Continuous discovery costs real time and money every week. Sooner or later someone senior asks what it is producing, and “we understand our users better” is not an answer that survives a budget review.
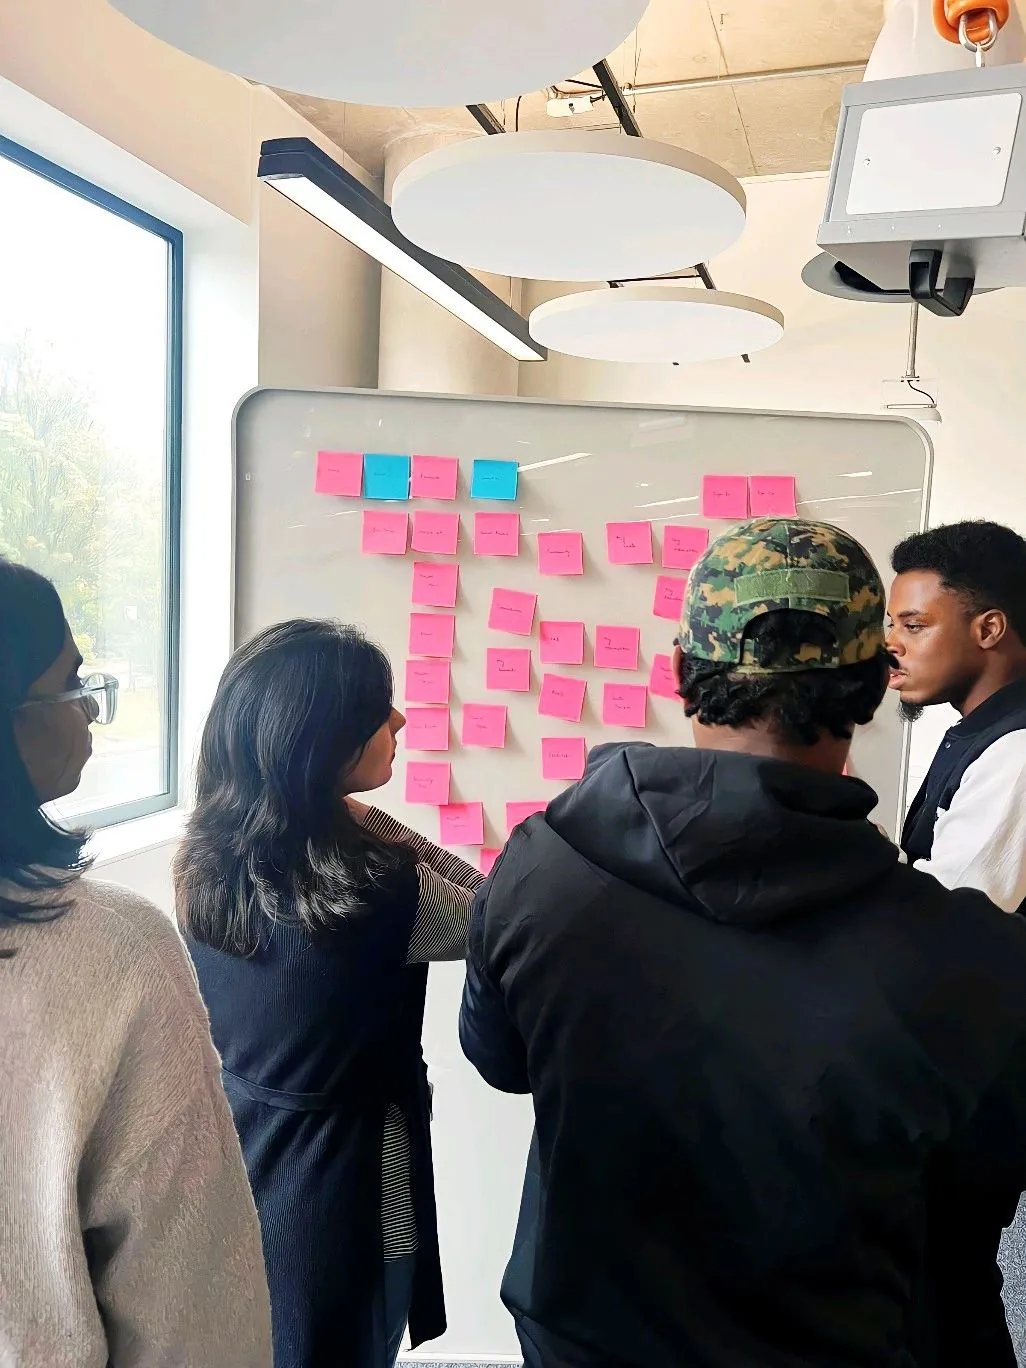
For my MSc thesis I asked eight practitioners how they measure the impact of discovery, and put the same question to a product team in a workshop. Between them they produced a practical set of measures.
Start with a north star, fed by input metrics
The strongest framing came from a participant who described having a top metric that works like a north star: if you influence it, it moves revenue, market share and the other big business numbers. Underneath it sit input metrics that the team can affect directly week to week.
This is what connects discovery to the business. You are not arguing that research is valuable in the abstract. You are showing that the thing you moved feeds the thing leadership already watches.
Measure the discovery work itself
These are the signals specific to how well discovery is running:
- Number of user touch-points. A simple count of how often the team is actually in contact with users.
- Quantity and quality of insights generated, both qualitative and quantitative.
- Time taken to generate insights. Speed matters in continuous discovery, and this is measurable.
- Where the blockers are in current discovery and delivery efforts.
That third one is easy to overlook and genuinely useful. If it takes three weeks to get from an interview to a decision, your loop is not continuous, whatever the calendar says.
Measure the delivery effects
Discovery is supposed to change what gets built and how smoothly. Practitioners tracked:
- Deployment frequency and the lead time between errors.
- Sprint commitments and carryover, which show whether the team is committing to the right work.
- Team health scores, which one participant compared against other teams and found consistently improving.
- Outcomes rather than outputs. The focus was on optimising results, not counting what shipped.
They also emphasised making sure projects actually transition from concept to implementation. Discovery that never reaches delivery is an expensive hobby.
Measure the business result
Here the workshop data is useful, because it shows how a product team instinctively frames value. Their answers, each with two votes:
- Insights lead to product ideas, which lead to business outcomes being realised.
- Improvements happen on the back of the results.
- Time and cost spent on research against the success of the product.
- Tracking improvement metrics over time.
- Uptake of the features that were requested.
- Revenue generated.
- Customers feel heard.
That last one deserves attention. It scored as highly as revenue, and it is not soft. If customers can tell that you listen, they keep telling you things, which is the entire supply chain for continuous discovery.
The team also listed customer satisfaction, achievement of goals, and reaching a wide cross-section of users so the feedback is diverse.
Measure the cultural shift
Several participants tracked something less tangible: how the organisation itself was changing. Impact showed up in leadership behaviour, in how teams made decisions, and in whether people started asking for evidence unprompted.
One participant summed the whole topic up neatly: quality comes in the ability to impact. Research is worth most when it visibly changes what people decide, not when it produces a thorough report.
Keep stakeholders informed along the way
A practical point that came up repeatedly. Do not save your impact story for a quarterly review. Keep stakeholders updated with progress and interim results, so the value is visible continuously rather than in one big reveal. That sustains buy-in, and it makes the case for the researcher’s role at the same time.
Set the results you want up front, be realistic about how long they take, and let people see them unfold.
Put it in the KPIs
One of the twelve guidelines from my thesis is to include discovery metrics in team performance indicators: insights generated, speed of iteration, and the effect of discovery on product decisions. Once it sits in the KPIs, discovery stops being the first thing cut when budgets tighten.
Further reading
- Teresa Torres, Product Talk. producttalk.org
- My MSc research. Read the case study
Next, read the benefits of continuous product discovery or the 12 guidelines for adopting it.
Based on my MSc thesis on continuous product discovery. The research is written up in the case study.